Blog
How to Measure Training Progress: 5 Methods That Work
Contents
Progress in strength training is easy to claim and surprisingly easy to measure wrongly.
More weight on the scale can mean muscle, fat, water or simply a full stomach. More training volume can deliver a better stimulus — or just more fatigue. And one bad set on Monday proves no plateau.
So the most useful question is not:
“Which single metric shows my progress?”
But:
“Which metric measures my actual goal — and which metrics only explain the route to it?”
An outcome and a training dose are two different things
Before the five methods, this distinction matters.
If your goal is more strength, a higher 1RM, or better performance at comparable loads, is an outcome.
If your goal is muscle growth, changes in muscle girth, standardised photos or other body measurements are possible outcomes.
The number of working sets you do, by contrast, is a training dose.
It can explain why you are progressing or why you are stalling. But 18 chest sets instead of 12 does not automatically mean your chest has grown.
That distinction is exactly what prevents one of the most common tracking mistakes: confusing input with output.
Method 1: compare performance on the same exercises
For strength training, the most direct progress question is:
Can you do more in the same movement today than you could before?
That does not always have to be a new 1RM.
Suppose six weeks ago on the bench press you managed:
80 kg × 8
Today you manage:
80 kg × 10
Then you have got more capable at exactly that task — even with no extra weight on the bar.
Or instead of 80 kg × 8 you do:
82.5 kg × 8
That is clear progress too.
Why rep PRs are often more useful than constant max testing
A genuine 1RM test can be reliable, but it is not needed to make every small change visible.
So in normal training, rep PRs are very practical:
- more weight at the same rep count
- more reps at the same weight
- on bodyweight exercises: more clean reps
- on time- or distance-based exercises: a longer duration or greater distance
hitPR distinguishes several PR types accordingly, so that progress is not understood only as “the heaviest bar of my life”.
The most important comparison still stays the same:
Are the exercise, the technique and the conditions similar enough for two performances to be comparable at all?
A considerably deeper squat with 120 kg is not automatically worse than a high squat with 125 kg.
Method 2: use the estimated 1RM as a trend
When weight and rep count change at the same time, the comparison gets harder.
Which is better?
- 90 kg × 6
- or 95 kg × 4?
An estimated 1RM (e1RM) can help here.
One well-known formula is the Epley equation:
e1RM = weight × (1 + reps ÷ 30)
Which gives roughly:
- 90 kg × 6 → 108 kg e1RM
- 95 kg × 4 → 108 kg e1RM
So by that approximation the two sets sit almost level.
An e1RM is an estimate, not a hidden max test
Formulas get less accurate when
- the rep count goes high,
- the exercise changes,
- the set ends a long way from muscular failure
- or technique and range of motion shift.
Which makes the absolute number less interesting than the trend under similar conditions.
If your bench press e1RM climbs roughly from 105 to 108 to 111 kg across several weeks, that is usable information.
Whether your real 1RM is exactly 111 kg is a different question.
Method 3: watch RPE or RIR on comparable work
Sometimes your performance improves before a new PR appears on paper.
For example:
Four weeks ago:
80 kg × 8 at RPE 9
Today:
80 kg × 8 at RPE 7–8
Weight and reps are identical. Even so, today’s work was probably easier.
So RPE, or RIR, can supply an additional layer:
- RPE 10 corresponds roughly to no reps left in reserve.
- RPE 9 roughly one rep in reserve.
- RPE 8 roughly two reps in reserve.
A 2024 systematic review concludes that RPE scales in strength training relate meaningfully to load and movement velocity and can be used practically to manage loading.
RPE stays subjective, though.
Sleep, motivation, stress, experience with the exercise and even your expectation of a set influence the rating.
Which is why a single
“today it was RPE 8 instead of 9”
is not yet a reliable strength gain.
A recurring trend on the same exercise, load and rep count is considerably more interesting.
Method 4: record body data that matches the goal
Strength and muscle growth are not the same goal.
You can get stronger without visibly building more muscle mass. And you can build muscle mass without a new strength record falling every week.
So if hypertrophy or body composition is your goal, you need additional data.
Body weight: useful as a trend, weak as a single value
Body weight can fluctuate from day to day through water, salt, carbohydrate, gut contents and many other factors.
A single value is therefore rarely very informative.
Better, for instance:
- measuring conditions as similar as possible
- several measurements per week
- a weekly average from those
- comparison across several weeks
If you are gaining over the long run in a building phase and your training performance is climbing at the same time, that fits the goal in principle.
Whether the gain consists of muscle, fat or both is not something the scale alone can tell you.
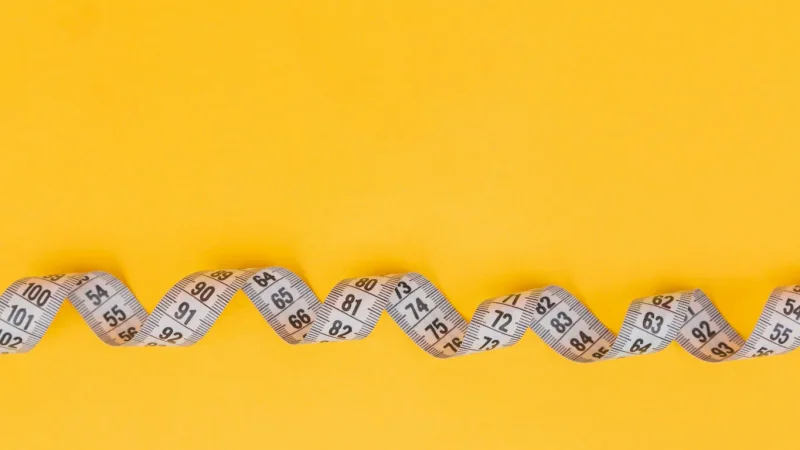
Measurements: simple, but only with standardised measuring
Waist, upper arm, thigh, chest or hips can supply additional clues.
What matters is less a supposedly perfect measuring site than repeatability:
- the same site
- the same tape
- a similar time of day
- a similar posture
- the same tension or relaxation as far as possible
If your upper arm is bigger after three months while your waist stays largely stable and your pulling and pressing performances climb, that says considerably more than a single body fat number on a scale.
Photos: only comparable when the conditions are comparable
Photos help, as long as you do not turn them into a completely different measuring instrument through lighting and posing.
In practice:
- the same perspective
- a similar distance
- the same lighting
- a similar time of day
- the same posture
- comparison every 3–4 weeks rather than daily
You handle that outside hitPR. A private album is entirely enough.
Body fat percentage: interpret with caution
BIA scales and other consumer methods can be useful for watching long-term trends, but their individual readings are easily disturbed.
So I would not conclude automatically from
weight rising + displayed body fat staying the same
that:
“that was pure muscle.”
Body weight, measurements, photos and training performance together give a more robust picture.
Method 5: use training dose and consistency as a diagnosis
This section covers a metric that matters — but is not your progress itself.
How many productive working sets does a muscle get per week?
The current 2026 ACSM position pools 137 systematic reviews. For muscle growth, higher weekly volume was advantageous on average; roughly 10 or more sets per muscle per week performed better in the pooled evidence than very low volumes. At the same time, the data shows diminishing additional returns as the set count keeps rising.
That is a statement about training dose, not about your individual outcome.
And this is where tracking gets useful.
Suppose your chest has not developed as expected for eight weeks.
Then you can look up:
- Are you actually training it regularly?
- How many effective sets add up?
- Was the volume suddenly cut?
- Are the sets getting harder or only more numerous?
- Did performance and recovery drop at the same time?
Those are diagnostic questions.
12 → 16 sets is not a success report.
It is a change in the dose, whose effect you then have to judge through performance and body data.
Where does relative strength fit in?
The ratio of strength to body weight can be useful when your body weight changes considerably, or when you want to compare yourself against weight classes.
A 100 kg bench press at 70 kg body weight and 100 kg at 100 kg body weight are not the same thing in a competitive context.
There are simple relative metrics and established powerlifting scores for that.
- Strength standards give you a rough placement.
- The Wilks/DOTS calculator allows comparisons across different body weights.
For your personal training progress, though, that is no substitute for absolute performance.
If you go from 75 to 82 kg of body weight in a building phase while your deadlift climbs from 160 to 185 kg, your strength-to-weight ratio can look less spectacular even though you have very clearly got stronger in absolute terms.
So relative strength answers a specific question:
How much performance am I producing relative to my body weight?
Not:
Have I made progress at all?
What you should not use as your only indicator of progress
Soreness
Soreness mainly tells you that your tissue responded to an unfamiliar or demanding situation.
It is no reliable measuring instrument for muscle growth or training quality.
No soreness does not mean a session had no effect.
Sweat and exhaustion
A workout can destroy you completely and still fit your goal badly.
Fatigue is a cost of training — not automatic proof of a good stimulus.
Calorie readouts from machines
For judging whether your bench press or your muscle mass is progressing, estimated workout calories are barely any help.
Total weight moved on its own
“Tonnage”, or sets × reps × load, can be useful within the same exercise but becomes misleading fast.
10 × 100 kg squats and 20 × 50 kg give the same tonnage but are not the same training performance.
How often should you actually review your data?
Not every metric needs the same rhythm.
| Metric | Sensible rhythm |
|---|---|
| weight / reps / PRs | record at every session |
| e1RM | as a trend across several comparable sessions |
| RPE / RIR | per relevant working set, if you can rate it reliably |
| body weight | several measurements → weekly average |
| measurements | roughly every 3–4 weeks |
| photos | roughly every 3–4 weeks |
| set volume per muscle | look weekly, interpret across several weeks |
The common denominator:
Record often enough to see trends — but evaluate seldom enough not to mistake daily noise for progress.
What to do when progress apparently stops
Do not rebuild the program straight away.
Check first:
- Has a trend really stalled? Or were only one or two sessions bad?
- Are the comparisons fair? Same technique, range of motion and exercise?
- Are you training consistently enough? Missed sessions explain a lot.
- Does your recovery match the goal? Sleep, nutrition and stress change training performance.
- Does the dose fit? Only now does the set count get interesting.
If the training dose really does look too low, more volume can make sense.
If you are already training a great deal while performance and recovery are both dropping, less can be the better adjustment.
Which is exactly why minimum effective volume is more helpful as a concept than the blanket rule that “more sets solve every plateau”.
How hitPR represents progress
An app does not make your progress better. It can only save you from reassembling the data every time.
In hitPR, things like
- rep PRs
- maximum reps
- time and distance bests
- set history
- muscle loading
get pulled together over longer periods.
The interpretation is still the part that matters, though.
If your muscle heatmap is more filled in, that means: more training dose.
If you now move 80 kg ten times instead of eight, that means: more performance.
Those two statements are not the same thing — and that separation is exactly what makes a training log useful.
Conclusion
Progress in strength training cannot be reduced to one number.
For strength, performance, rep PRs and e1RM are the most direct metrics. For muscle growth, body weight, measurements and standardised photos come on top. RPE or RIR can show that the same work is getting easier. And training volume and consistency explain which dose sat behind those changes.
Which makes the most important rule fairly simple:
Measure your goal as an outcome — and use training data to explain it.
Further reading:
Sources
- Currier BS, D’Souza AC, Singh MAF et al. (2026). Resistance Training Prescription for Muscle Function, Hypertrophy, and Physical Performance in Healthy Adults: An Overview of Reviews. Med Sci Sports Exerc. 58(4):851–872.
- Pelland JC, Remmert JF, Robinson ZP et al. (2026). The Resistance Training Dose Response: Meta-Regressions Exploring the Effects of Weekly Volume and Frequency on Muscle Hypertrophy and Strength Gains. Sports Med, 56(2):481–505. PubMed
- Schoenfeld BJ et al. (2017). Dose-response relationship between weekly resistance training volume and increases in muscle mass. J Sports Sciences, 35(11):1073–1082.
- Hernández-Belmonte A et al. (2024). Validity of Rating of Perceived Exertion Scales in Relation to Movement Velocity and Exercise Intensity During Resistance-Exercise: A Systematic Review.
- Grgic J et al. (2020). Test-Retest Reliability of the One-Repetition Maximum (1RM) Strength Assessment: a Systematic Review. Sports Med Open, 6:31.
- Epley B. (1985). Poundage Chart. Boyd Epley Workout.
Frequently Asked Questions
How do I measure my training progress?
How often should I check my progress?
What should I do if I stop seeing progress?
Related Articles


Coming soon
Coming soon for Android and iOS. Be there for the launch.